Literacy: American Civil War Poem

Associated Explainer

American Civil War,

Caused the whole country to struggle

The war between the North and the South,

Through oppositions that had  been aroused.


The first reason is the Climate and Slavery,

The main reason caused the huge tragedy

The weather is hot in the South,

Depending on slaves in every house.


The nutritious soil in the region,

Allowed them almost year-round growing seasons

They need workers who’ll work for free

So they brought and support the slavery.


Growing and harvesting of such crops as rice, cotton, and tobacco

Allowing their economy to grow.

Southerners enslaved Black Africans for free labor

To increase their production in agriculture.


As in the North the temperate weather

Has low dependant of cheap farmers

They rely on the growth of an industry

The reason that made them opposed to slavery.


The second cause is lacking of compromise,

The two regions only cared about their own enterprise,

The South wanted to count the slaves as white people

To increase the number of representatives in the Capitol.


At the same time they don’t want the “same blacks included in the number of citizens”

“For which the states had to pay taxes to the central government.”

As in the North there were less slave,

Losing the election


The two regions deeply disagreed on other issues, such as the states’ rights

Also the main reason that led them to fight.

The South became so inflamed with this controversy,

“which 630,000 young Americans died in the bloodiest war of [their] history.”


The South creating their own culture,

Created “a ruling class with economic interests, political ideals” and strong code of honor.

The South become even more violent,

It is one of the reasons that  led to the mounting tension.


The main causes of the American Civil War,

Not enough compromises in the federal

Different perspectives on the government

Also the different opinions on slaves dependant.


Those were the reasons behind the tragedy

Causing thousands death and injury

The war lasted about 4 years,

630 thousands Americans had disappeared.


The victory went to the North, led by President Lincoln,

The hero to millions of slaves and an Americans icon.

Fighting in the bloodiest war in the history,

Ended the dependent on slavery.

Khmer Sight Foundation

Image may contain: 4 people, people sitting, table and indoor

In the first term of the Khmer Sight Foundation (KSF) project we trying to create the values and ideas improve the experiences that the patients would receive during the mission and especially during the screening. So we’ve been brainstorming the ideas that we want to do to help the KSF. After generating many ideas in the seminar hour we have a formal meeting with the KSF’s board to make the ideas possible. The outcome of the meeting were three different videos to educate the patients how to protect their eyes, about diabetes and eye disease, and last but not least is the video that teach the new volunteers how to do the screening. We’ve finished one of the video now and soon all. And we hope that every Khmer people will protect their eyes well and most importantly changing the stigma of wearing the sunglasses.

Chemistry: Flame Test Lab

Objective: To observe the relationship between various elements and their emission spectrum.

Introduction:

Flame tests provide a way to qualitatively test for the presence of specific elements by seeing colored flames.  The heat of the bunsen burner excites the electrons in the atom, and this energy is released as the electrons “fall back” to their ground states. The color we see is a combination of the visible wavelengths of light emitted by the atoms.  

If you have a spectroscope you can also make quantitative observations. A spectroscope can be used to see a pattern of narrow lights called an emission (bright-line) spectrum.  The actually wavelengths of the spectrum serve as a quantitative test to determine atoms identities.  Each element has a different “pattern” of electrons, so it will show a different combination of colors.  

In this lab you will perform flame tests on seven different elements. You will use your observations to identify an unknown solution.  


Prelaboratory Questions: (In a section labeled PRELAB- answer the following questions in FULL sentences)

  1. Why do we see colors in the flame tests?
    1. We see color in the flame lab because the bunsen burner excites the electrons i the atom, and the energy is released as electrons and showing the quantized energy which we see the color.
  2. How will we be testing the substances qualitatively?
    1. We will testing the substance qualitatively by observing the color of different salt compound and check the wavelength of those color.

Materials:

Safety goggles , wood splints, tongs/tweezers, Bunsen burner, test tubes with various compounds

Safety:

  1. Safety goggles must be worn at all times
  2. Many of these salts are toxic. If you come into contact with any of the compounds make sure to notify teacher and wash the contacted area thoroughly. Wash your hands before leaving the lab!

Procedure:

  1. Light the Bunsen burner (turn the gas on so you can just hear it, then use the striker)
  2. Place the wood splint for each compound into the flame using tongs or tweezers- ONE AT A TIME!
  3. Take note of the color of the flame and return the wood splint to the solution.
  4. CLEAN UP YOUR STATION! Carefully put the stoppers back on the solutions! Make sure the station looks like it did when you started! Let me know if you need new splints!
  5. Wash your hands thoroughly before leaving the laboratory

Data Table: make a section of your lab labeled Data Table and make a data table similar to the one below to record your observations.

Compound

Color of Flame (qualitative)

Wavelengths of light (in Å) (quantitative)

Barium Chloride Yellow 570 nm – 590 nm
Calcium Chloride Orange-ish-red Orange: 590 nm – 620 nm

Red: 620 nm – 750 nm

Copper (II) Chloride Green (abit Blue) Green: 495 nm – 570 nm

Blue: 450 nm – 495 nm

Lithium Chloride Red-ish-pink 620 nm – 750 nm
Potassium Chloride Orange 590 nm – 620 nm
Strontium Chloride Red 620 nm – 750 nm

Unknown #1

Red-ish-violet Red: 620 nm – 750 nm

Violet: 380 nm – 450 nm

Discussion and Analysis: (In a section labeled Discussion and Analysis answer the following questions in complete sentences)

  1. How do your results from the flame test provide support for quantized energy levels? Explain your answer.
    1. The results from the flame test provide support for quantized energy by the number of the wavelength that we know from the color of each of the salt compound.
  2. The unknown compound is one of the other six. Identify it and explain HOW you figured it out using the results of your experiment.
    1. The unknown compound is one of the other six, and I think it is the Lithium Chloride because they have the same quantized energy and during the experiment the color of both compound is the same.

Conclusion: (answer in a complete paragraph and in complete sentences)

What are two possible sources of error for this lab. How would the errors affect your lab? What would you do differently next time to counteract these errors?

  1. The two possible sources of error for this lab would be the drop of the previous chloride onto the flame in which will cause in bias result of color of the next compound. Another one is about how we interpret the color where it will lead to different interpretation of the wavelength or quantized energy of each of the compound. So the next time we do this lab we will need to make sure the flame is clean after testing for one compound before testing another compound. And trying to do more replications for each of the compound so that we get the valid result which mean the valid color and quantized energy.

Khmer Essential: Writing The First Khmer Book

This term we had published our first ever Khmer book which is the Khmer poems. We’ve been working on this project about 2 years now, and finally we can published it happily. At first the students in the class learned different types of Khmer poems and then we started to write our individual poems. In that class, I wrote about 8 poems within the course of 3 weeks about different occasion, including love, places, and the sight in Cambodia. Our book is about 200 pages covered about 6 different topics. On the other hand, we also participate in the Khmer Reading and Writing Festival in Battambang to promote our book. At there we got to know some of the well known writers in Cambodia and share our Khmer poem book to them. Currently, we are working to find fund and sponsorship in order to publish more books.

Healthcare Exploration: Healthcare System

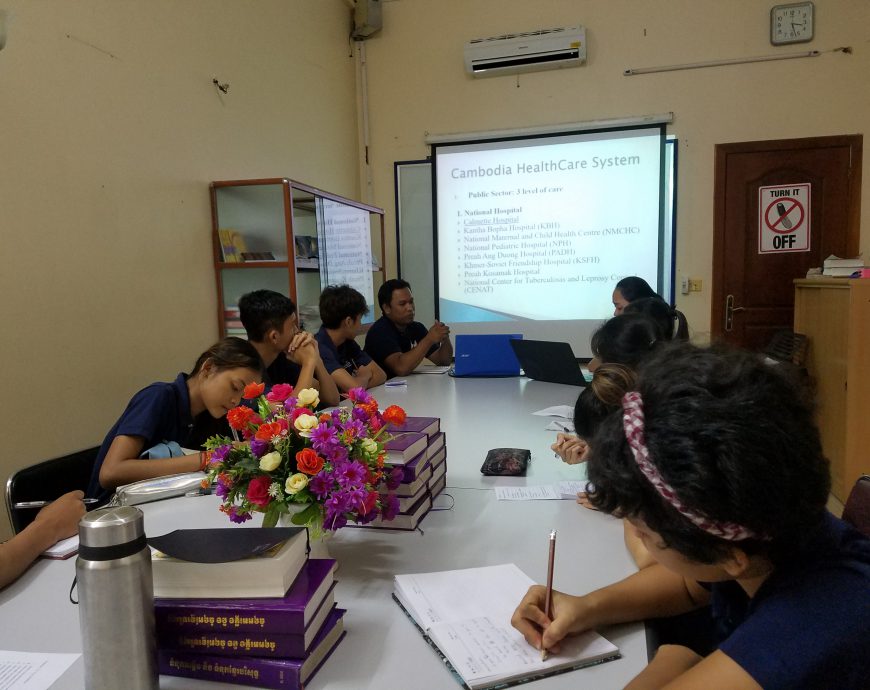
In the first term of the exploration, we are focus generally in the healthcare system in Cambodia. In this exploration we’ve been to many of the health-related organizations and public and private hospital to gather their perspectives on the current Cambodian’s healthcare system. In this first round we try to gather as much as possible of the general informations about the healthcare system in Cambodia. The outcome of that is that we will chose our individual route that we are interesting in after hearing the perspectives from those doctors. So for the next round I want to focus more into science within health sector. Where I want to learn and research more about the medicine, the scientific one and the traditional one, moreover I want to know where do we get the ingredients to make medicine. Beside that I want to work with health-related organization volunteering to educate other people about health.

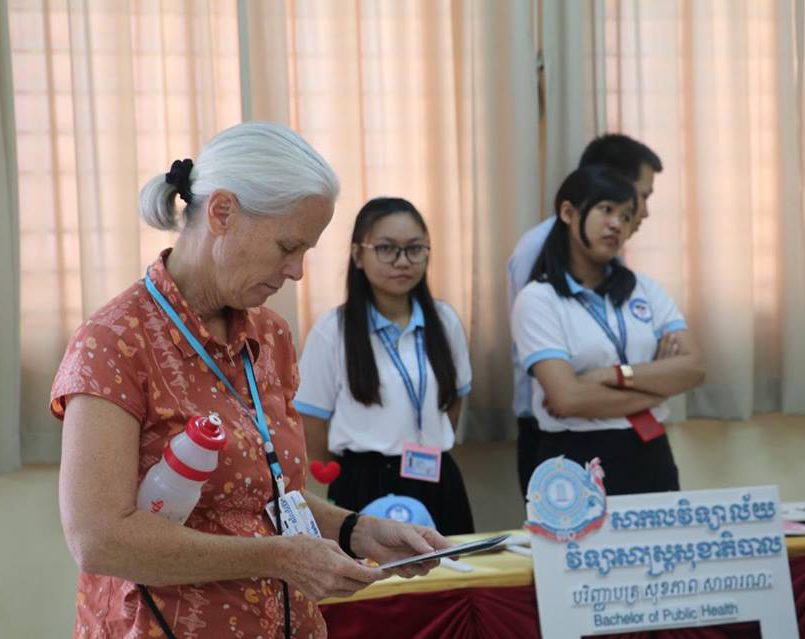
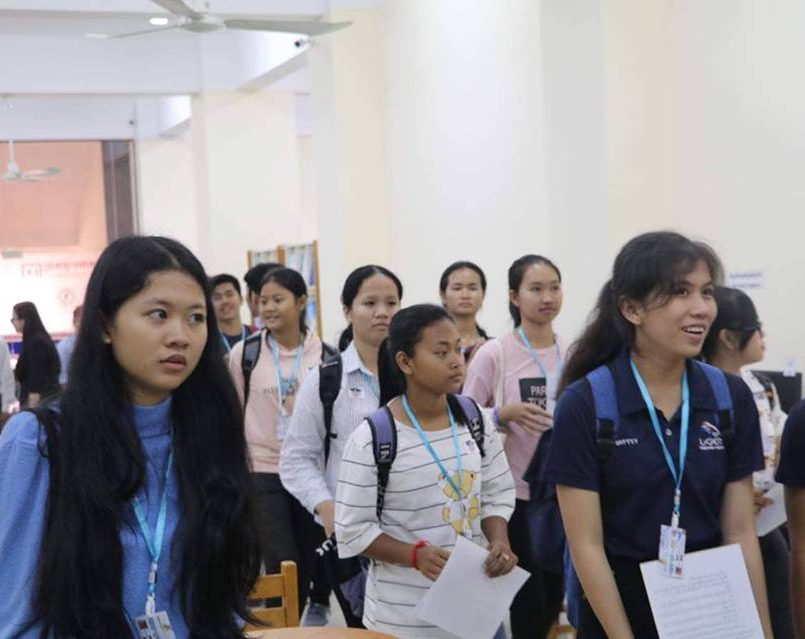
Specifically, on the 28th of September, the Healthcare Exploration went to an open-house at the University of Health Sciences (UHS). We registered in three different departments: Public Health, Dentistry, and Pharmacy. Specifically, in dentistry, we’d been toured to different labs, and meet their 7th-year students who were practicing dental care.

In the Public Health department, we were given an overview of what is public health, since it is a new major offered in 2013. Then, we heard the story of success from their first graduate and a student who is reaching the end of her bachelor study and were led into the information room. There, booths were set for participants to interact, ask questions to the students who study there, and read the research paper done by the professor and founder of the degree. Then, lastly, open house ended with them giving a tour of their library and study spaces.

University of Pharmacy is part of the UHS, and the pharmaceutical course has the most hand-on learning experience than any other medical department. There are three different types of classes, theoretical, laboratorical learning that practices theories learned, and researching. There are labs such as: DNA extraction from pathogens, plants identification, substance extraction, household-use products production such as hand soaps and soap bars. Some places require us to wear lab coats due to the risk of biohazard and contracting diseases. However, the most interesting part of this opening event is, learning that the university values the Khmer traditional medicine; instead of brushing it off due to its lack of scientific proof, one of the main lessons is focusing on understanding the science behind the traditional treatment, and uses the discovery to improve the modern medicines.

Fun Fact: Unlike the other universities in Cambodia, this university administer their tests digitally; where each student would have to answer a set 60 randomized questions within an hour.

AP Biology: Calculating Flying Insect Biodiversity Using Simpson’s Diversity Index LAB

Calculating Flying Insect Biodiversity Using Simpson’s Diversity Index

Content standards

  1. Ecosystem Structure (biological populations and communities, ecological niches, species diversity) 
    C. Ecosystem Diversity (biodiversity, natural selection, ecosystem services) 

Biodiversity is a hot topic. In the wild, habitats are shrinking and species are becoming extinct—lost forever—some without humans even discovering them. Biodiversity is also an issue closer to home. Planting large fields of a single genotype crop (e.g., corn or wheat) can make food sources vulnerable if that genotype becomes susceptible to a new pest or drought. An entire crop can be lost. In contrast, wild populations are more genetically diverse, so some individuals usually survive adverse conditions. 

When studying the biodiversity of a community, a simple survey of the number of different species (species richness) in an area seemingly would give a clear picture of the diversity. As the following example illustrates, a calculation of the species richness alone doesn’t give that clear picture. It’s not until the distribution of those species (also called species evenness) is added to the calculation that the biodiversity of a community is more accurately portrayed. 

Objectives:

  • Calculate diversity values for sampled habitats, using 2 indices—species richness and Simpson’s Index
  • Understand the differences between various ways of measuring and defining biodiversity

Time requirement

Sticky trap preparation and installation      30 min
Insect trapping                                        At least 1 hr (can leave traps in place overnight)
Insect collection                                      30 min
Analysis of data                                      30 min

Materials

  • 100 Sticky Traps
  • 4 Hole Punches
  • 4 Permanent Markers
  • 100 Paper Clips
  • 4 Rolls of String
  • 8 to 16 Hand Lenses

Safety:

Use caution when collecting living samples since they can include harmful organisms. 

Preparation (teacher)

  1. Prepare 4 sets of material that each include 25 sticky traps, a hole punch, a permanent marker, 25 paper clips, and a roll of string.
  2. Examine your campus and identify areas that seem appropriate for collecting flying insects, e.g., along a chain link fence, off a tree branch, or between 2 fixed objects (where it’s possible to tie string tightly to each object). Compile a list of areas suitable for collection. Ultimately, allow groups to pick their locations from the list.
  3. Divide your class into 4 groups and assign each group a letter.

Note: This activity is best done when there isn’t a lot of air moving. Wind can dislodge sticky traps. 

Procedure:

  1. Punch a hole in the top of each sticky trap.
  2. Using a permanent marker, label each trap with your group letter and number traps from 1 to 25.
  3. Go outside.
  4. As a group, decide which designated flying insect habitat to study. Consider how you will use the paper clips and string to ensure that all 25 sticky traps are in a single habitat. Secure the traps to branches, fences, or between 2 immovable objects (using tightly tied string). Best results occur 3 to 5 ft off the ground. Note: Be sure the traps are in a single habitat and are set at the same general height and in the same general conditions. Setting traps in multiple conditions will skew the results.
  5. After setting each trap, remove the wax paper from the sticky trap.
  6. Return to the classroom.
    Note: Wait at least 1 hour or, if necessary, until the next class period.
  7. Go outside, collect the sticky traps, and return to class.
  8. Place your group’s sticky traps in numerical order and use a hand lens to examine the specimens.
  9. As a class, decide on consistent morphotype name designations (e.g., black spotted, red dotted, small black, big brown, or large round) for samples. Then enter the chosen names for morphotypes into the table (see Figure 1 for an example). This allows for combining data accurately later in the activity.
  10. Divide the 4 groups of students into pairs. Then divide the sticky traps evenly among the pairs of students. One of the student pair identifies the insects and, using the agreed-upon names for morphotypes, the other student counts and records the number of each morphotype in the Sample Data Table (see Figure 2).
  11. After all of the data from each student pair is entered into the data table, calculate the species richness and Simpson’s Diversity Index for each habitat.

Figure 1 Example Data Table of Morphotypes (using class-designated names)


Morphotype # Morphotype Description number number/total (number/total)^2
1 spider 2 0.01142857143 0.0001306122449
2 winged black ants 6 0.03428571429 0.001175510204
3 bee 1 0.005714285714 0.00003265306122
4 horsefly 16 0.09142857143 0.008359183673
5 big blue wasp 0 0 0
6 snail 2 0.01142857143 0.0001306122449
7 green iridescent fly 5 0.02857142857 0.0008163265306
8 mosquito 31 0.1771428571 0.03137959184
9 small fly (fruit flies, tiny black flies) 94 0.5371428571 0.288522449
10 moth 3 0.01714285714 0.000293877551
11 wingless ants (tree ants, red ants) 0 0 0
12 small hoppers 12 0.06857142857 0.004702040816
13 cricket 0 0 0
14 beetle 3 0.01714285714 0.000293877551
15 Water strider 0 0 0
16 Worm 0 0 0
  Total 175 1 0.3358367347
      Simpson = 1 – 0.6641632653
      Simpson 0.335836735


Figure 2 Sample Data Table

Habitat Types Simpson (Species Richness)

Total: 16 species

Simpson’s Diversity Index
Zone A : Behind Senior Housing 11 0.2790007048
Zone B : King Seven Pond 10 0.6347107438
Zone C : Mango Trees 11 0.5580145239
Zone D : Garden 12 0.6641632653

Questions

  1. Compare the species richness and diversities of the 4 different habitats studied. Which habitat was more diverse in terms of richness and evenness? What evidence do you have?
    1. According to the Species Richness graph Zone D has the most diverse in terms of species richness and evenness because of all the habitat Zone D has the most number of species (12 species). Moreover, according to the Diversity Index Zone D has the most.

  2. How does the diversity of each habitat compare using the Simpson’s Diversity Index as opposed to just species richness? Which is more accurate?
    1. The diversity of each habitat compare using the Simpson’s Diversity Index as opposed to just species richness is that the Simpson’s Diversity Index is more distance from each other where is the species richness is more clump together. I think Simpson’s Diversity Index is more accurate because Simpson’s Diversity Index is a measure of diversity which takes into account both richness and evenness.
  3. Describe your group’s habitat in terms of its biotic and abiotic conditions. How did these conditions influence the species richness and diversity of insects in that habitat? Do the types of insect found “fit” that habitat? Why or why not
    1. My team we are measuring the biodiversity of flying insect in the garden area. There are many abiotic conditions such as soil, water, dead wood, and composed; moreover, there are also many biotic conditions such as grasses, trees, and small plants. I think the condition that influence most about the species richness and diversity of insects in that habitat is the composed where we can see in my team there are many fruit-flies were trapped. I think those type of insects in that habitat  is fitted because the fruit-flies especially attracted to the composed.
  4. How does your habitat compare to other habitats around campus? What factors could have led to differences in diversity between the habitats?
    1. I think my habitat is similar to the other habitats around the campus, but one factors that could have led to differences in diversity between the habitats is that the composed and small bushes where it attracted a lot of different kinds of insect especially different types of flies and mosquitoes.
  5. Was your community of insects primarily composed of primary consumers, secondary consumers, or a combination of both? What inferences can you make about the rest of the community in this habitat?
    1. My community of insects primarily composed of primary consumers, and some mix of both; most of the primary consumers were organism that eat fruit and leaves, such as fruit-flies and horse-flies, as well ants. Moreover, the insect such as mosquitos and spider there are secondary consumers where they prey upon other small insects. I think there also a lot of decomposer as well, because the habitat is wet as well as human influence where we, Liger’s students, making composed there.
  6. Was your data accurate? Why or why not? Could this methodology have been improved upon? What other factors could have been measured to account for species diversity?
    1. I think my data isn’t accurate due to many influences one of which is rain. Before the experiment, I think that we will got a lot of horse-flies because of the composed but then it turns out that there are less of horse-flies. I think the methodology should be change where we try to choose different places in Liger or outside where the habitats is much different from each other moreover try to have less influences on the habitat that causes the result to be bias. I think the other factors could have been measured to account for species diversity are the area of the habitat and the influences in the habitats.
  7. Why is it important to take into account both species richness AND evenness when assessing community diversity?
    1. It is important to take into account both species richness and evenness when assessing community diversity because the species richness is contributed to increase in biodiversity also which is an important aspect biodiversity; moreover the species evenness measure the ratio between each organisms where is if we have species evenness this show that the community diversity is healthy.
  8. Why do you think biologists assess species diversity of a community? What does it tell you about the health of the ecosystem?
    1. I think the biologists assess species diversity of a community because they want to know about the species richness as well as the species evenness of an ecosystem. As there more and more species richness and those species are even up on each other the ecosystem is healthy.
  9. Which of the following habitats is more diverse: A habitat including 10 species, each represented by 2 individuals? Or a habitat including 10 species, 1 of which is represented by 85 individuals and the remaining 9 species represented by 1 individual each? Explain your answer.
    1. The habitat that include 10 species, each represented by 2 individuals is more diverse. Because diversity is measure how rich the species in a habitat and evenness of species in the habitat. Both habitats has the same number of species but the first habitat the number of species is even but the second habitat is unbalance between the species evenness so it makes the first habitat is more diverse than the second one.